What Is the Fear & Greed Index?
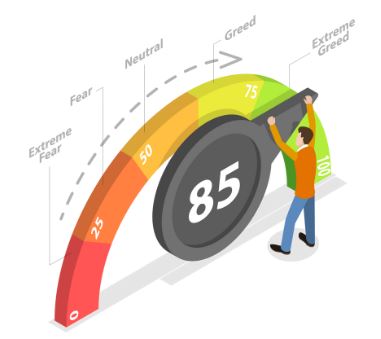
The Fear & Greed Index is a tool that measures the mood of the market—whether investors are feeling scared (fear) or overly optimistic (greed). It uses a score from 0 (extreme fear) to 100 (extreme greed), based on seven indicators like price momentum, market volatility, and demand for safe assets. When fear dominates, prices often fall as investors sell off; when greed takes over, prices rise as people rush to buy.
How Does It Work?
• Extreme Fear (0–24): Investors are very worried, often selling at low prices.
• Fear (25–44): Investors are cautious, but not panicking.
• Neutral (45–55): Balanced mood, with no strong trend.
• Greed (56–75): Optimism rises, more buying.
• Extreme Greed (76–100): Euphoria, risk of bubbles and sharp corrections.
The index is updated daily and reflects the current emotional state of the market, not a prediction of the future.
How the Giraffe Investor Uses News and Sentiment
The Giraffe—our semi-passive investor—stands tall and keeps a lookout for big changes in the jungle. Instead of watching every price move like the Gorilla, the Giraffe reads the news and pays attention to signals like the Fear & Greed Index to decide when to adjust their investing.
How to Use News Like the Giraffe
• Watch for Extreme Sentiment:
When the Fear & Greed Index shows extreme fear, it often means prices are low and many investors are selling in panic. The Giraffe sees this as a possible opportunity to buy more bananas (assets) at a discount.
• Don’t Get Caught in the Herd:
When the index shows extreme greed, the Giraffe knows the herd is rushing in and prices may be overheated. Instead of buying more, the Giraffe might slow down purchases or save cash for the next correction.
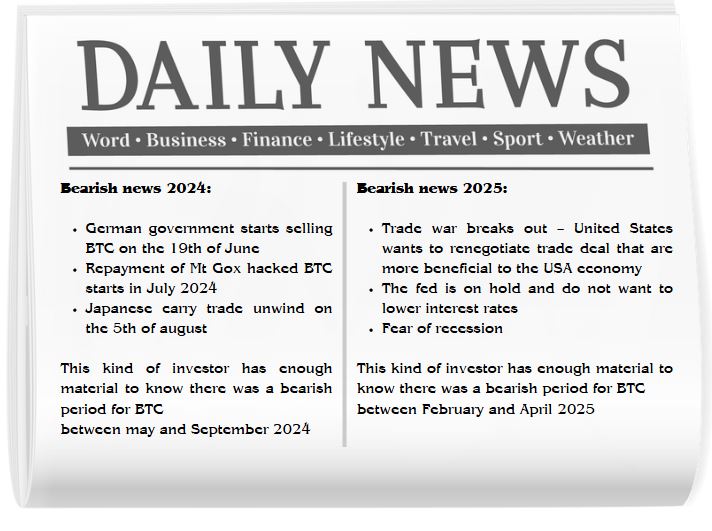
• Use News as Confirmation:
The Giraffe reads headlines about big events—like government sales, economic shocks, or central bank decisions—to confirm what the Fear & Greed Index is showing. If both news and the index point to fear, the Giraffe increases their DCA (dollar-cost averaging) or deploys saved cash. If both show greed, the Giraffe holds back.
• Stay Disciplined:
The Giraffe never lets a single news story or a sudden swing in the index dictate their whole plan. Instead, they combine these signals with a steady saving and investing approach, adjusting only when the evidence is strong.
Imagine banana prices in the jungle are falling, and the Fear & Greed Index shows extreme fear.
The Giraffe reads news about a drought (bad for bananas) and sees the other animals are panicking. Instead of running away, the Giraffe calmly buys more bananas, knowing that fear often brings bargains. When the drought ends and the index swings to greed, the Giraffe slows down and saves up for the next rainy day.
In summary:
The Fear & Greed Index is a thermometer for market emotions. The Giraffe investor uses it—along with news—to decide when to buy more or hold back, always keeping a cool head and a long view over the jungle.
—
What is DMA (Daily Moving Average)?
Imagine you want to know if the price of an asset is generally going up or down, but the price jumps all over the place every day. The DMA takes the closing prices from the last few days, adds them up, and divides by the number of days. This gives you a new, smoother line that shows the average trend, not just the noisy daily moves.
Suppose you want to calculate a 5-day DMA for a stock, and the closing prices for the last 5 days were:
(1) 10$, (2) 12$, (3) 11$, (4) 13$, (5) 14$
⟶ Add them up: = 60$
⟶ Divide by 5: = 12$
Tomorrow, you drop Day 1, add the new closing price and repeat:
(2) 12$, (3) 11$, (4) 13$, (5) 14$, (6) 15$
⟶ Add them up: = 65$
⟶ Divide by 5: = 13$
In a nutshell: DMA helps you see the average price over time, making it easier to spot trends. It smooths out the daily “noise” so you can focus on the bigger picture.
Picture this:
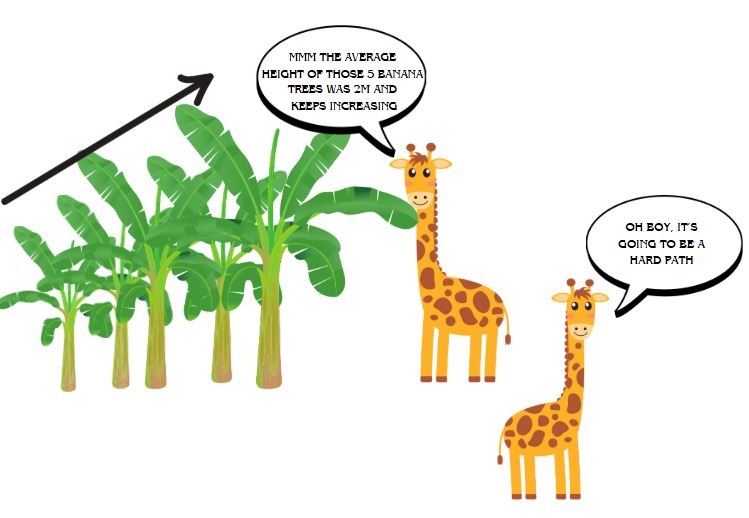
• The giraffe walks through the jungle, marking each day’s banana tree height (the closing price).
• Every day, the giraffe looks back at the last 5 (or 10, or 20) trees it passed and calculates the average height.
• It then draws a smooth line through these averages, creating a visible path above the jungle floor.
• This line is the DMA—it helps the giraffe see the overall direction, not just the daily ups and downs.
Why the Giraffe Loves the DMA
• Big Picture: The giraffe isn’t distracted by every rustle in the leaves (short-term price noise).
• Trend Spotting: By following the DMA line, the giraffe knows if it’s heading toward a lush valley or a dry hilltop.
• Smart Decisions: The giraffe uses this path to decide when to get more bananas (invest more) or save some for later.
In short:
The giraffe’s DMA is its “jungle roadmap”—a smooth, reliable guide that helps it see the trend and avoid getting lost in the daily chaos

Leave a comment